Does CSR Follow Need, or Need Follow CSR? CSR Spending by State in India (FY 2024-25)
India’s CSR spending crossed ₹40,794 crore in FY 2024-25. But when you look at CSR spending by state and divide that number by population, the map of corporate giving looks nothing like the map of development need.
India’s corporate social responsibility spending rose 17% year-on-year to a record ₹40,794 crore in FY 2024-25, up from ₹35,918 crore the previous year.
On paper, this is a good-news story: more capital, more companies participating, more projects on the ground. Cumulative CSR spending since the mandate came into force has now crossed ₹2.61 lakh crore, up from just ₹10,066 crore in the mandate’s first year, FY 2014-15.
But aggregate growth can hide an uneven map underneath it. And once you look state by state, and then per person, a different, more uncomfortable question emerges.
Who is that money actually reaching?
What CSR spending by state looks like
CSR in India has always tracked corporate geography closely, and there are practical reasons for that. Companies invest where they already have offices, factories, employees and NGO relationships. Site visits are easier, monitoring is simpler, and CSR committees can more directly see the link between the business and the community it funds.
The FY 2024-25 numbers, as reported on the National CSR Portal, reflect exactly that pattern, and the concentration is deepening, not easing. The top 10 states accounted for 74% of total CSR investment in FY 2024-25, up sharply from 61% the previous year.
| State | CSR received, FY 2024-25 | Share of national total | Notable trend |
| Maharashtra | ₹8,631 crore | ~21% | #1 for the 10th consecutive year |
| Gujarat | ₹4,549 crore | ~11% | +68% YoY, fastest-growing state |
| Karnataka | ₹3,395 crore | ~8% | Anchored by IT sector |
| Delhi | ₹2,753 crore | ~7% | Anchored by administrative/HQ presence |
| Tamil Nadu | ₹2,738 crore | ~7% | Anchored by manufacturing base |
Source: National CSR Portal, Ministry of Corporate Affairs (csr.gov.in)
Maharashtra alone accounts for roughly a fifth of everything India spends on CSR, a position it has now held for a full decade, driven largely by Mumbai’s status as the country’s financial capital. Gujarat’s 68% jump is the standout trend of the year, tied to the state’s expanding manufacturing, petrochemical, and pharmaceutical industrial base: as more companies headquarter or scale operations there, the CSR pool tied to that corporate ecosystem grows with it.
At the other end of the absolute-spending scale, states and Union Territories including Manipur, Puducherry, Nagaland, Leh & Ladakh and Mizoram received the lowest total CSR investment in the country, a gap that sector analysts have repeatedly flagged as a call to action.
There’s nothing inherently wrong with concentration at the top. The problem starts when we treat the distribution of corporate activity as a reasonable stand-in for the distribution of social need. It isn’t, and the gap between the two is exactly where the next part of this story lives.
The states that need CSR most are often the states that get the least
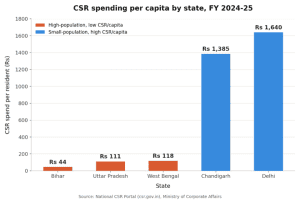
- Per-capita analysis inverts the totals-based story: reveals concentration, not spread.
Delhi (₹1,640) and Chandigarh (₹1,385) top the per-resident rankings only because small populations sit on large CSR inflows. Maharashtra and Gujarat are the sole large-population states (50M+) to also crack the per-capita top 10, meaning real CSR reach, not just volume, is concentrated in a narrow cluster of states where companies are headquartered.
- High population, not low CSR growth, is what drains the neediest states’ per-capita numbers.
Bihar and UP both show strong absolute growth (12x and ~15x over the decade respectively; UP ranks 6th nationally in absolute CSR), so this isn’t a story of neglect in raw terms. But their populations (130M+ and 240M+) are so large that even that growth nets out to ₹44 and ₹111 per resident.
- The paradox: CSR clusters where companies cluster, not where development need is greatest, so the states carrying the heaviest poverty, health, and education burdens end up with the thinnest per-person CSR coverage.
Why this happens: the development trap
The mechanism behind this isn’t mysterious, it’s close to circular:
- A state needs investment to develop.
- Companies invest where infrastructure, skills, institutions and markets are already stronger.
- Those companies generate profits.
- Profits fund CSR.
- CSR gets deployed close to where those companies already operate.
More business, more CSR, stronger local ecosystem, more business.
Run the loop in reverse and you get the mirror image: fewer companies, smaller CSR pools, a weaker development ecosystem, and, over time, even less reason for new corporate investment to arrive.
To be clear, this isn’t an argument that CSR should or could substitute for public investment, industrial policy, or central and state government spending. CSR remains a small pool of capital relative to those. But ₹40,794 crore a year is no longer a rounding error either. At this scale, where it lands starts to matter for the states left out of the loop.
The hidden reason companies avoid underserved states: it isn’t only about will
It’s tempting to read the geography gap as companies simply choosing not to care about Bihar or Uttar Pradesh. The more accurate explanation is usually more structural: companies often cannot find the implementation partners they need in these states. Due diligence takes longer, monitoring costs more, governance systems may be less mature, and the perceived execution risk is higher. So CSR budgets default to what’s already known and de-risked.
What a more balanced system could look like, in practice:
- Local anchor, national allocation. Companies continue funding their operational geographies while deliberately routing a defined share of their CSR portfolio to high-need, low-funded states.
- Pooled CSR vehicles. Structures that let multiple companies co-fund vetted projects in underserved districts, spreading due-diligence cost across funders instead of duplicating it.
- Stronger intermediaries. Organisations with genuine on-ground presence across states, not just in the metros, that can identify, vet and monitor credible NGOs on a company’s behalf in geographies it has never operated in. HYNGO’s multi-state presence is built around exactly this problem: for a CSR team that is, say, three or four people covering a national obligation, it’s often the difference between a state staying off the map entirely and it becoming fundable. HYNGO handles the site visits, field-level monitoring and reporting on the company’s behalf, so “we don’t have people on the ground there” stops being a reason to default back to the same familiar cities.
- Better public data. CSR spending by state dataset that can be compared against poverty, education, health and climate-vulnerability indicators, so CSR committees can see the gap, not just intuit it.
The bigger picture: India’s CSR system has finished phase one
India has spent more than a decade building the plumbing of mandatory CSR: compliance systems, CSR committees, budget allocation processes, NGO partnership models, statutory reporting. That phase has largely been completed.
The next phase is harder, and it isn’t about the size of the pool. It’s about the intelligence of its distribution. Environmental CSR is a useful proof point here: environmental spending grew roughly 40% year-on-year in FY 2024-25, the fastest-growing major CSR theme, showing that corporate CSR priorities can shift quickly once companies decide something matters. Geographic equity could become the next priority to shift, if enough CSR teams start asking the question.
The fix can’t just be “companies should give more to underserved states.” It also requires building the infrastructure, vetted NGO pipelines, shared due diligence, local implementation partners, pooled monitoring, that makes those investments executable at the standard CSR committees and auditors expect. This is, in practice, where a CSR intermediary like HYNGO fits in: with presence spanning multiple states rather than concentrated in one or two metros, HYNGO can extend a company’s CSR reach into geographies where it has no local footprint, handling the vetting, on-ground monitoring and reporting that a lean, city-based CSR team simply doesn’t have the bandwidth to replicate state by state.
FAQs: CSR spending geography in India
How much did India spend on CSR in FY 2024-25? ₹40,794 crore, a 17% increase over FY 2023-24’s ₹35,918 crore, per data on the National CSR Portal, Ministry of Corporate Affairs.
Which state receives the most CSR in India basedon CSR spending by state? Maharashtra, which received ₹8,631 crore in FY 2024-25, roughly 21% of the national total, and has held the top spot for close to a decade.
Which Indian state is growing fastest in CSR inflows? Gujarat, whose CSR investment rose 68% year-on-year to ₹4,549 crore, driven by its expanding manufacturing, petrochemical, pharmaceutical and infrastructure sectors.
Which states receive the least CSR per capita? Bihar (₹44 per resident), West Bengal (₹118) and Uttar Pradesh (₹111) rank lowest among major states on per-capita CSR, despite being among India’s most populous and facing significant development needs. Delhi (₹1,640) and Chandigarh (₹1,385) top the per-capita list, largely due to their small populations relative to CSR inflows.
What share of CSR went to education and healthcare in FY 2024-25? Education receives the largest share at 34% (₹13,877 crore), followed by healthcare at 21% (₹8,531 crore). Together with environmental sustainability, livelihood enhancement and rural development, these five themes account for 75% of all CSR spend in FY 2024-25.
Why don’t companies fund CSR in high-need states more? It’s usually less about willingness and more about execution risk: fewer vetted, audit-ready NGO partners exist in these states, due diligence takes longer, and monitoring costs more, so CSR budgets default to established networks in familiar


